What Is an Audiogram?
What Is an Audiogram?
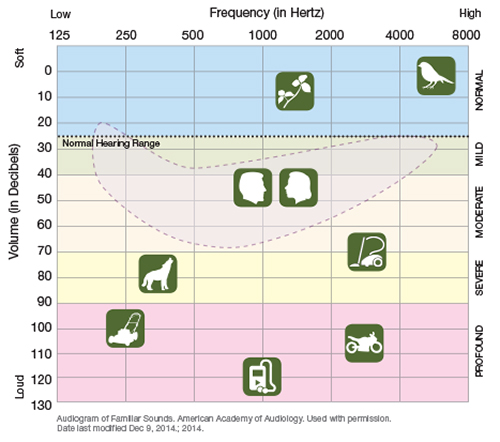
The results of your hearing test are shown on a graph called an audiogram. This graph shows which types of sounds you can and can’t hear. Hearing aids are prescribed based on the results of your audiogram. A sample audiogram is provided below.
How to read an audiogram
This sample audiogram can help you understand what your own audiogram shows about your hearing loss. On the sample:
Frequency (tone or pitch) is shown from left to right. As pictured above, a barking dog has a lower frequency than a vacuum cleaner.
Volume is shown from top to bottom. A dripping faucet (top of the graph) is much softer than a lawn mower (near the bottom).
Conversation sounds are shown inside the dotted line. Most vowel sounds are lower frequency and louder volume than most consonants.
Amount of hearing loss is shown in the labels on the right of the graph. Someone with mild hearing loss may only have trouble hearing birds or understanding conversation. A person with profound hearing loss may not even hear a bus go by.
Updated:
March 21, 2017
Sources:
Evaluation of Hearing Loss in Adults. UpToDate
Reviewed By:
Freeborn, Donna, PhD, CNM, FNP,Image reviewed by StayWell medical illustration team.,Kacker, Ashutosh, MD